
Start monitoring your environment in 5 minutes or less with ControlUp
![]() If you are serious about your IT environment you need to monitor it. And I mean monitor every aspect of it, not only if a server is up but also to see how it’s performing. And of course monitor things like your VMware, Netscaler and Citrix environments from one place. With ControlUp you can do this! ControlUp gives you 3 unique ways to do this.
If you are serious about your IT environment you need to monitor it. And I mean monitor every aspect of it, not only if a server is up but also to see how it’s performing. And of course monitor things like your VMware, Netscaler and Citrix environments from one place. With ControlUp you can do this! ControlUp gives you 3 unique ways to do this.
- Performance visiblity, a birds eye live view of your complete datacenter. It allows you to view user sessions, netscaler load balancer activity, hypervisor host load and so much much more.
- IT Insights, a smart cloud console in which you can view historical data and analyse performance trends. It will also automatically generate management reports for you.
- End User Experience, ControlUp will monitor the user session and will measure logon duration and application launch times. All this together will generate a User Experience Score. This will let you understand your users better.
One of the most awesome things about ControlUp is the ability to start monitoring in 5 minutes or less. So in this blog I will show you how to start monitoring. We will create a connection to a VMware hypervisor, Citrix XenDesktop 7.18 environment and a Citrix Netscaler 12.1.
First we need to go to www.controlup.com and click on Download ControlUp
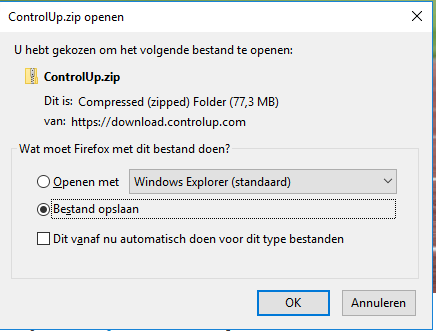
Of course, accept the download .zip and once the download is complete Unzip the ControlUp console to your Desktop.
Double click on the ControlUpConsole.exe
This will launch the ControlUp console.
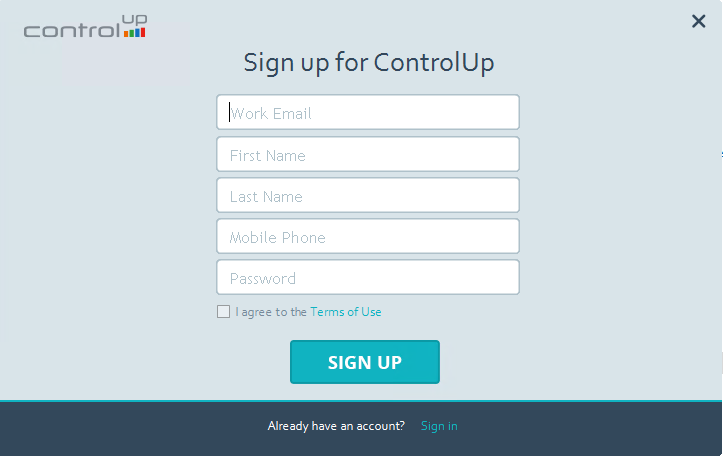
In the bottom click on Sign up and fill in your contact details. This will become your controlUP account.
Once you have created your account, the controlUp console will start.
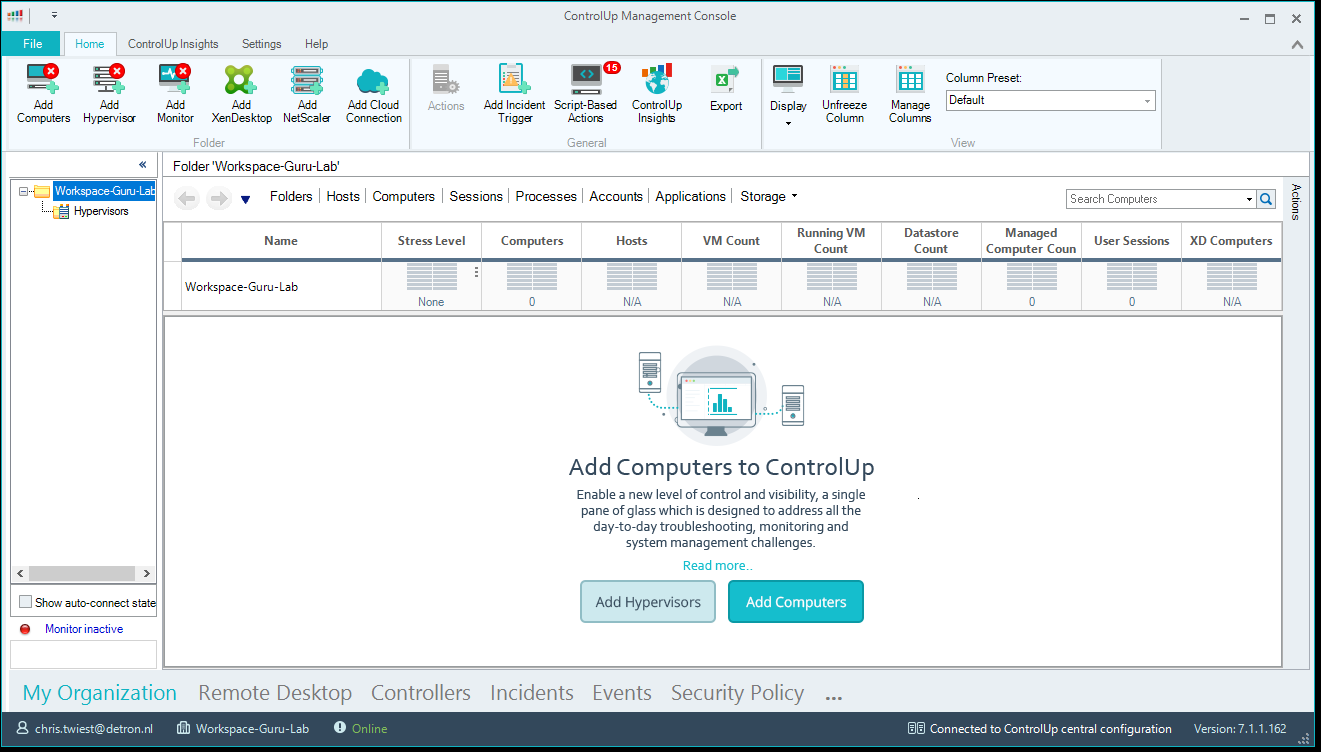
Click on Add Hypervisor

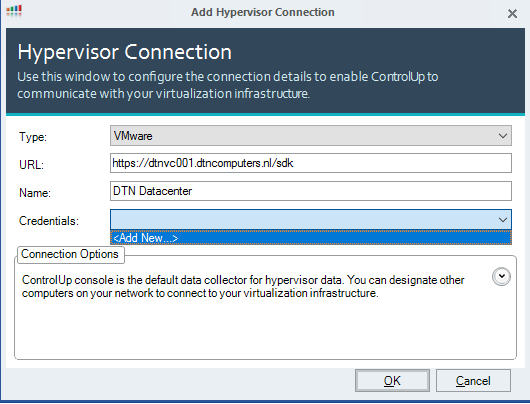
In this demo I will be connecting to my VMware vCenter server. Fill in the correct information for your environment and then click on Add New under credentials.
Here we are going to create credentials to connect to VMware in my demo. It’s a service account named savsphere.
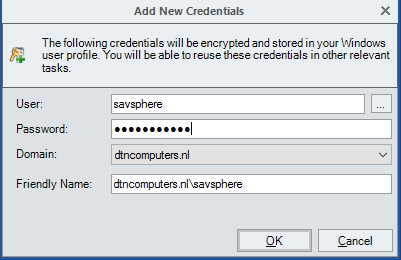
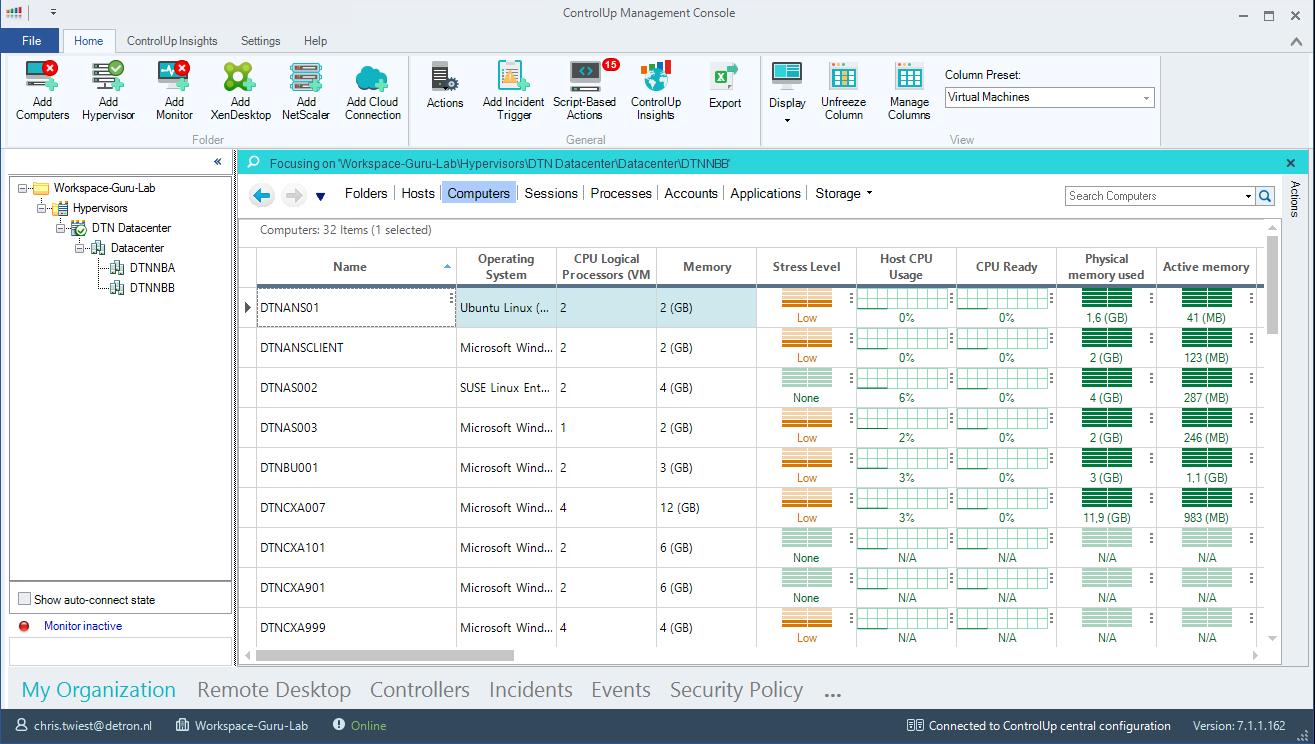
After that click on OK. You will now have a Hypervisor connection in your management server. By clicking on your hypervisor and then on Computers you will see all the performance information of your VM’s.
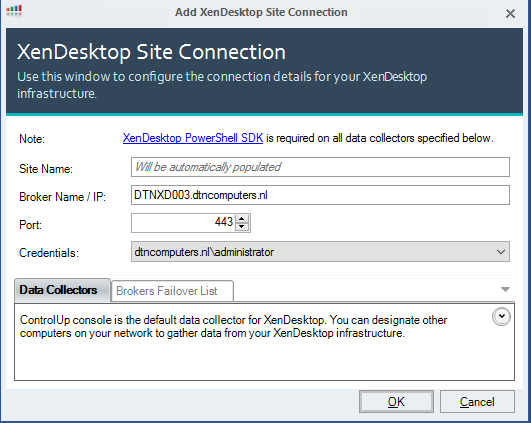
Now we’re going to add our Citrix XenDesktop environment. Click on Add XenDesktop.

Fill in the correct details for your environment and if necessary add new credentials and click on OK.
Now you can see your complete Citrix environment.

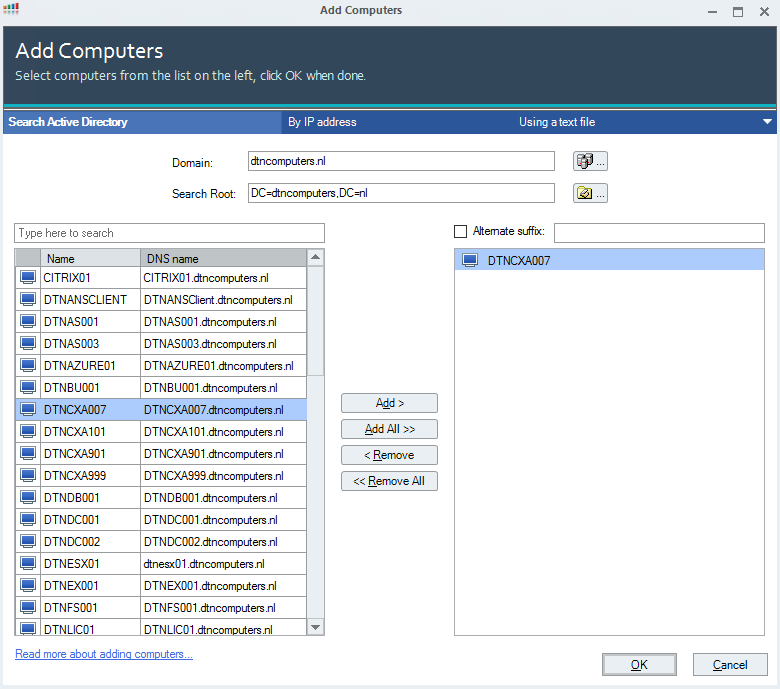
But what if we want to see more details of the user session? Then we need to install an agent on the VDI’s or RDSH. You can do this by c clicking right mouse button and then choosing Install Agent. Or you can add the machines as computers. Click on Add Computers.

Here you will be presented with all the computers in the domain. In my example I’m going to a Citrix XenApp machine and click on OK.
Under my Citrix environment I see my XenApp host and I can view user session information and see their User Experience score.

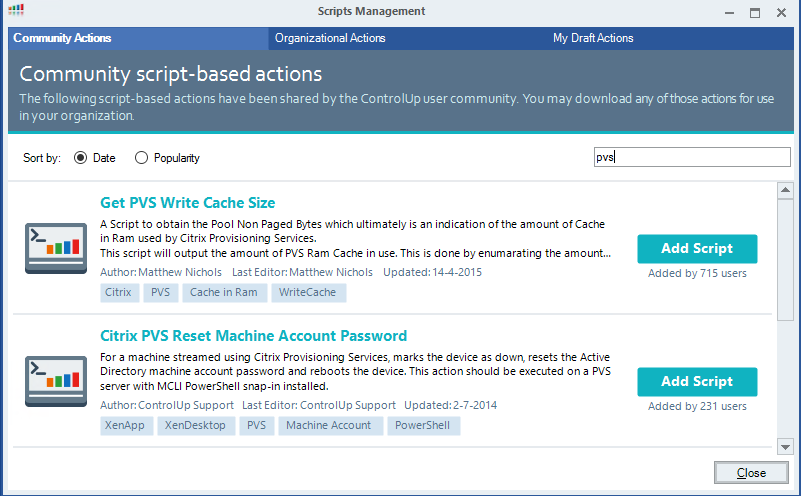
One thing most of us Citrix Admins struggle with is seeing how big the PVS cache is. ControlUp has a really easy solution for this. You can send Script Based Actions to an agent. ControlUp comes with a whole bunch of these script actions and one of them shows you how much PVS cache is using. Click on Script Based Actions.

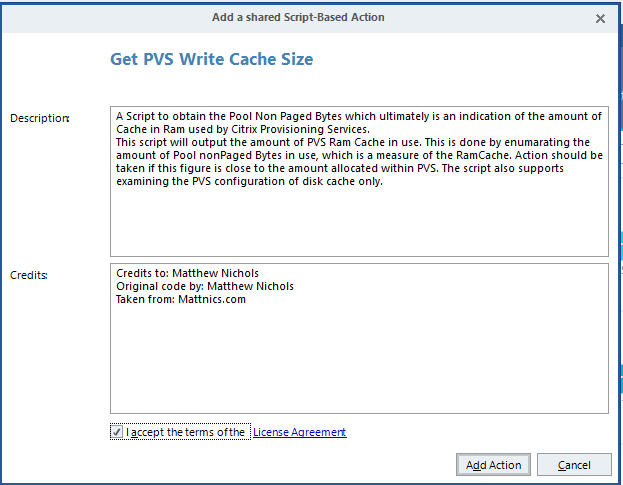
Search for pvs and click on Add Script.
Click on Add Action.
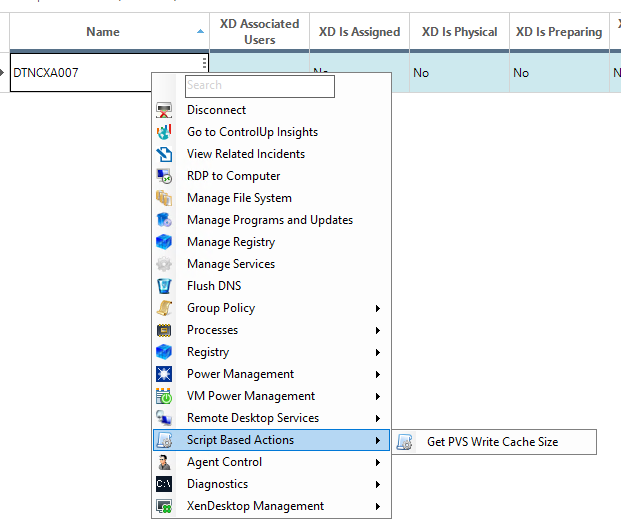
Now that the script is added, you can right click on your XenApp or XenDesktop host. Go to Script Based Actions -> Get PVS Write Cache Size.
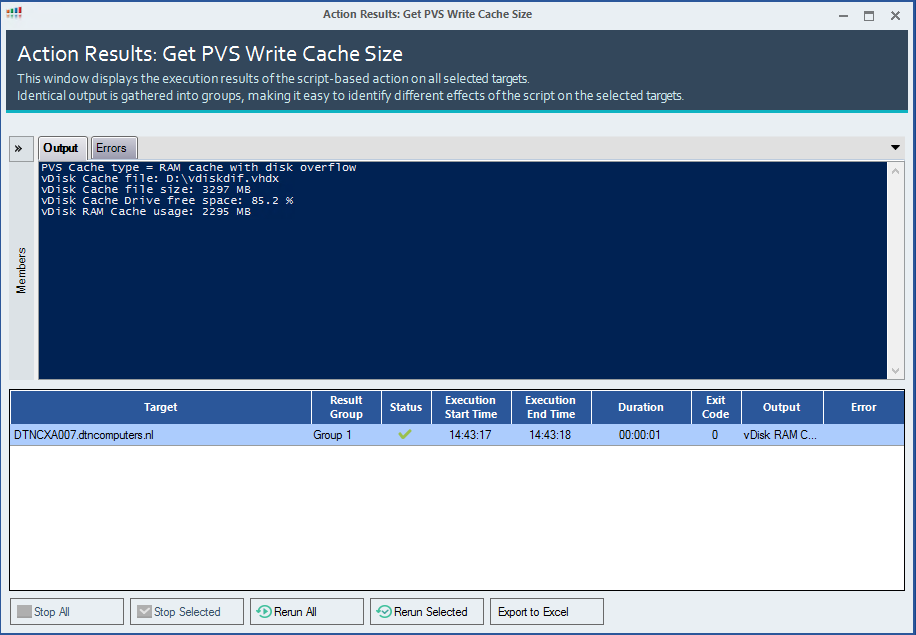
And here you will see the size of your PVS cache !
Now it’s of course time to add our Netscaler to ControlUp. Click on Add Netscaler

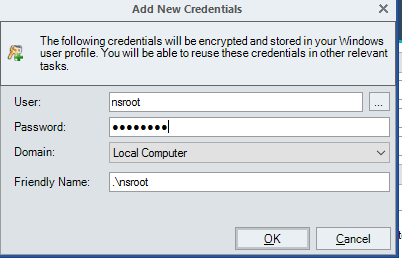
Fill in your netscaler details and click on Add New under credentials.
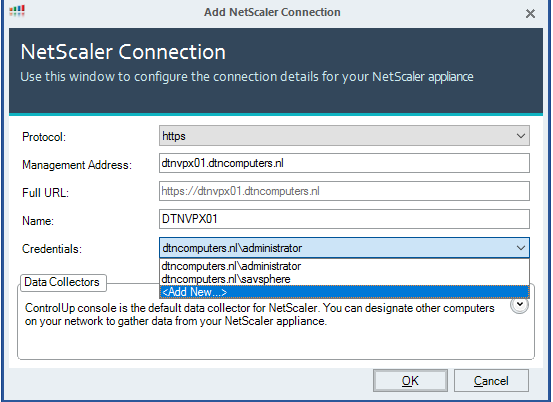
Add your nsroot account or another admin account.
Click on OK and in your console you will see your NetScaler. From here you can monitor your load balancers, external sessions and much more.
![]()
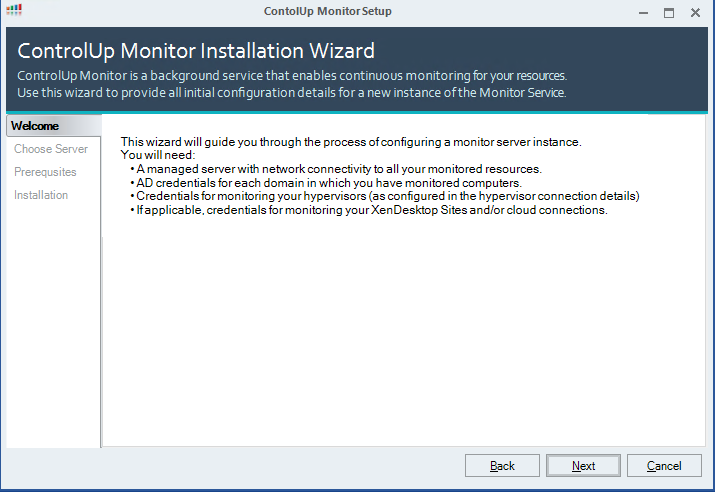
The last thing we need to setup is a ControlUp Monitor. The monitor will run as a background service on a machine and will continuously monitor your environment and upload the data to ControlUp Insights. Click on Add Monitor.

Click on Next.
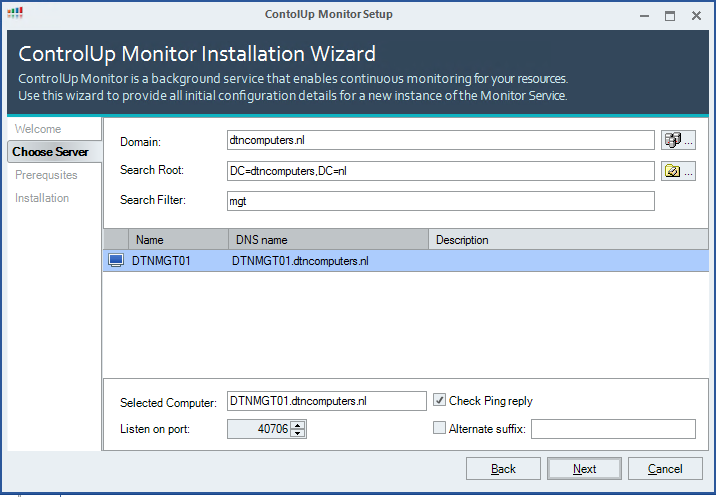
Search and select the server on which you want to deploy the ControlUp Monitor. And click on Next.
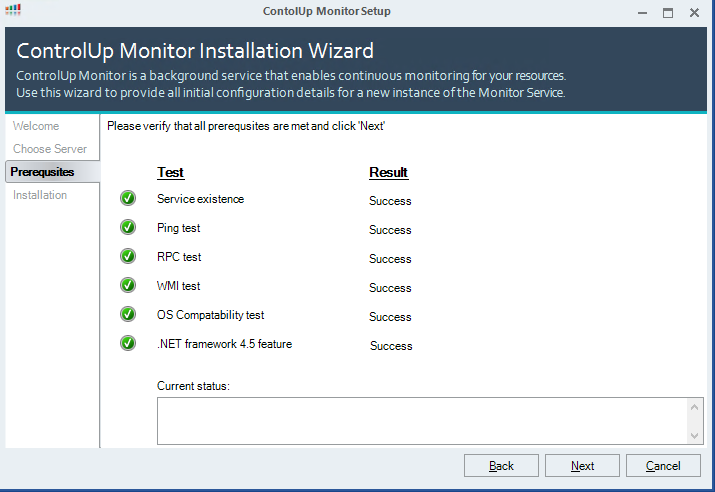
ControlUp will now test your server if it can become a Monitor. Click on Next when finished.
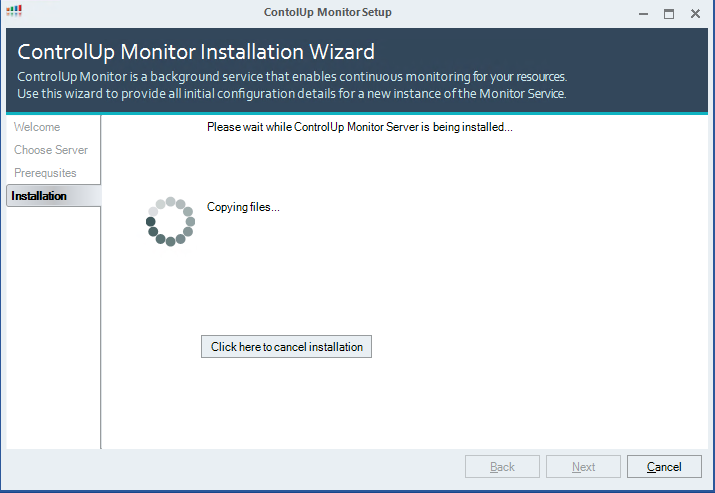
Now ControlUp will install the monitor on the selected server. Once finished click on Next.
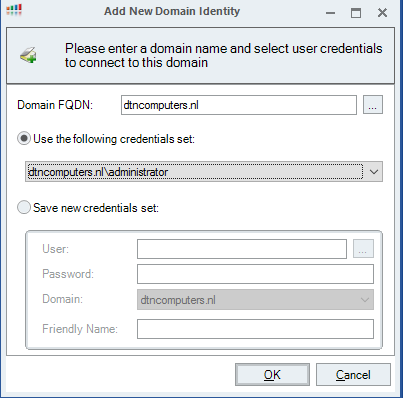
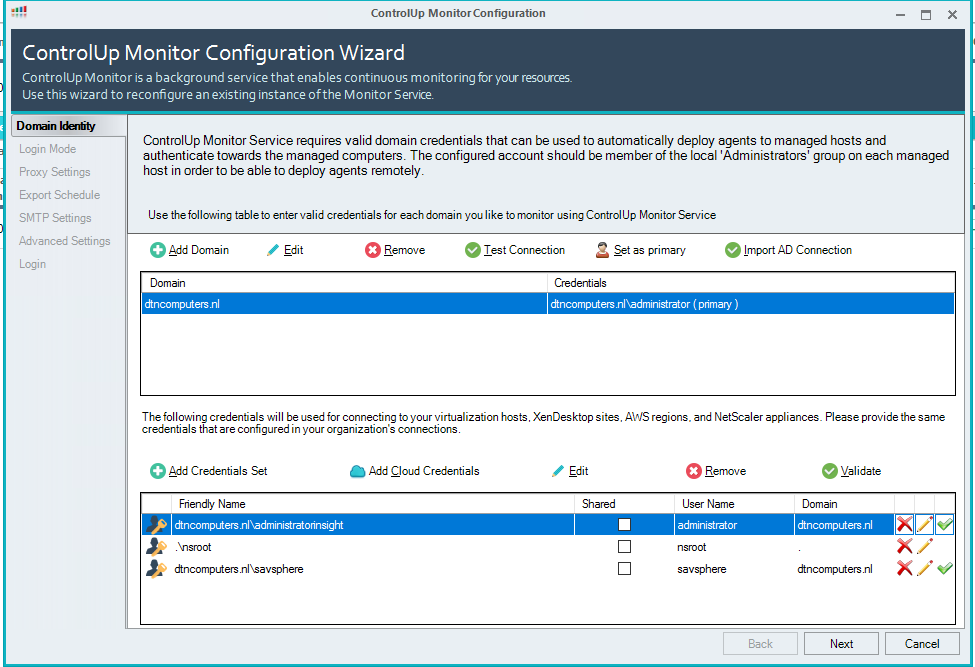
Now you must enter credentials to connect to your domain.
Once that’s done add all the credentials you used before in the bottom part by clicking on add credentials. These credentials are then used by the monitor to contact your resources. Then click on Next.
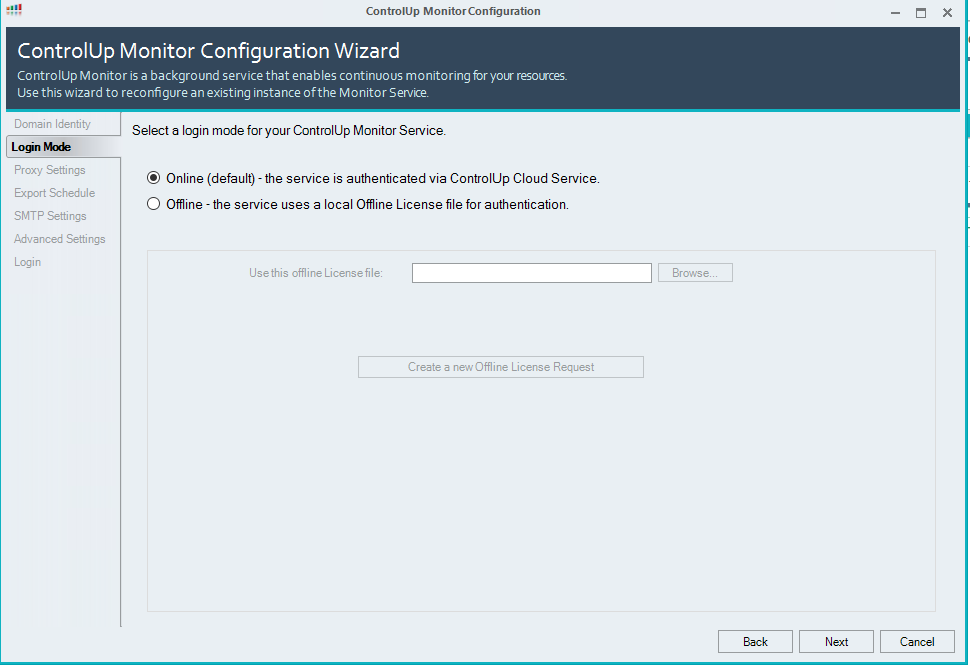
Select Online or Offline depending on your license and click on Next.
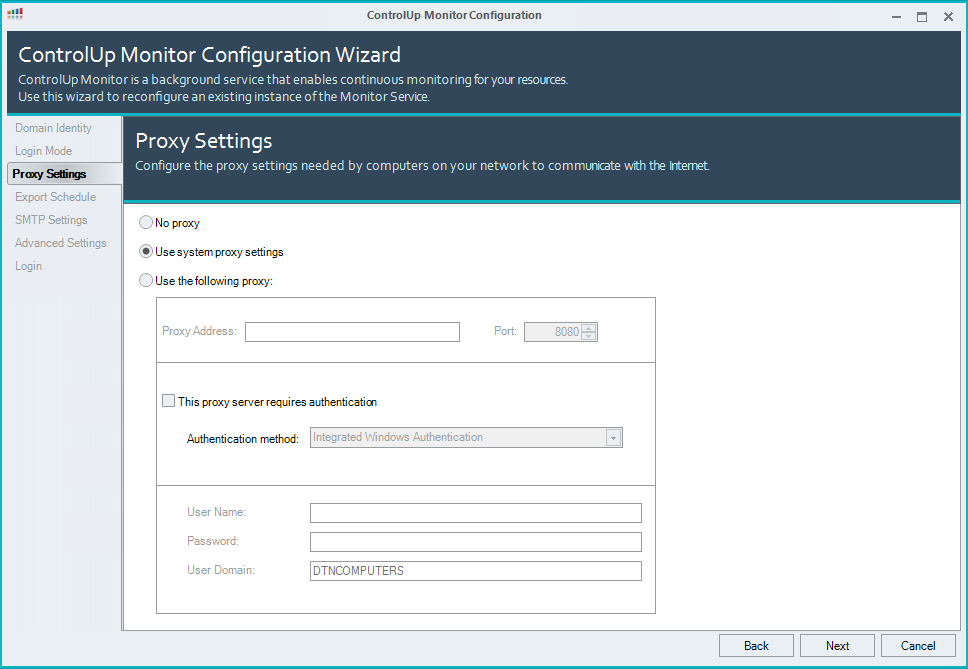
Enter your systems proxy if needed and click on Next.
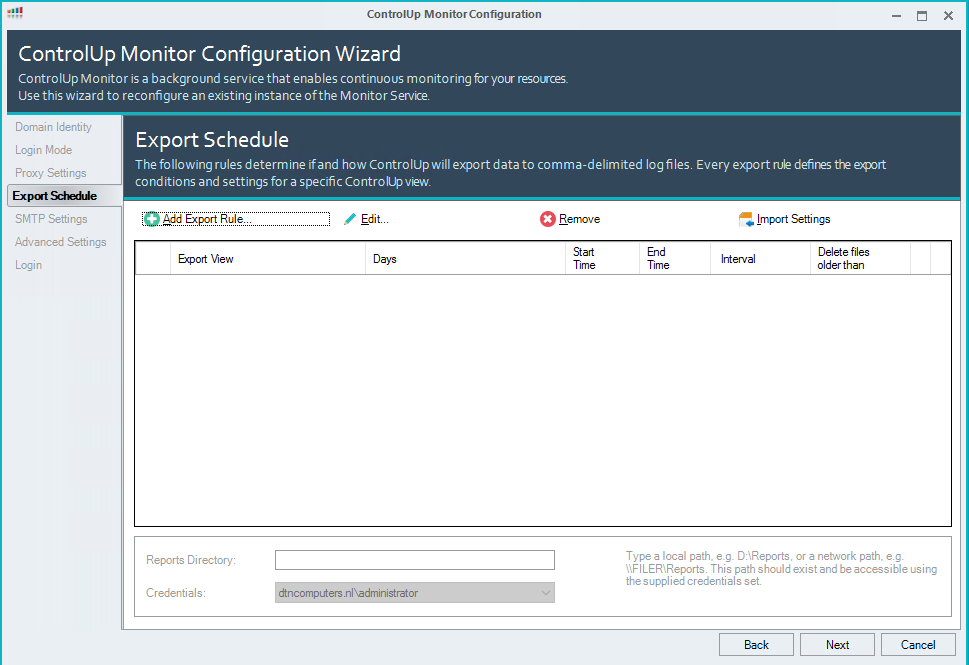
The export to Insights is automatic but you can optionally set a Export Schedule to do this, click on Export Rule.
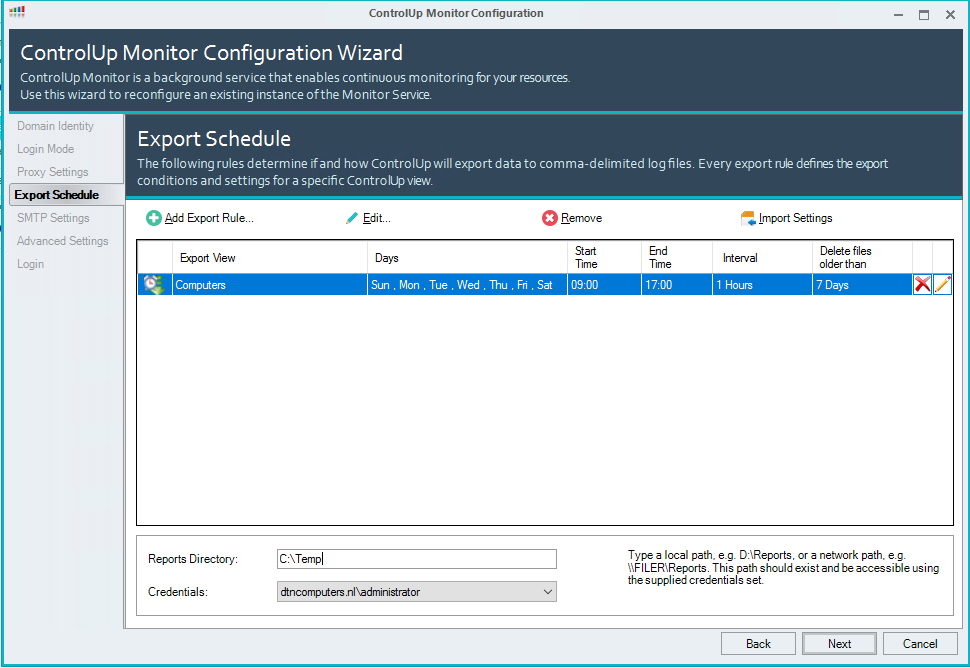
Fill in the schedule that best fits you and click on OK.

In the bottom enter a Reports Directory and click Next.
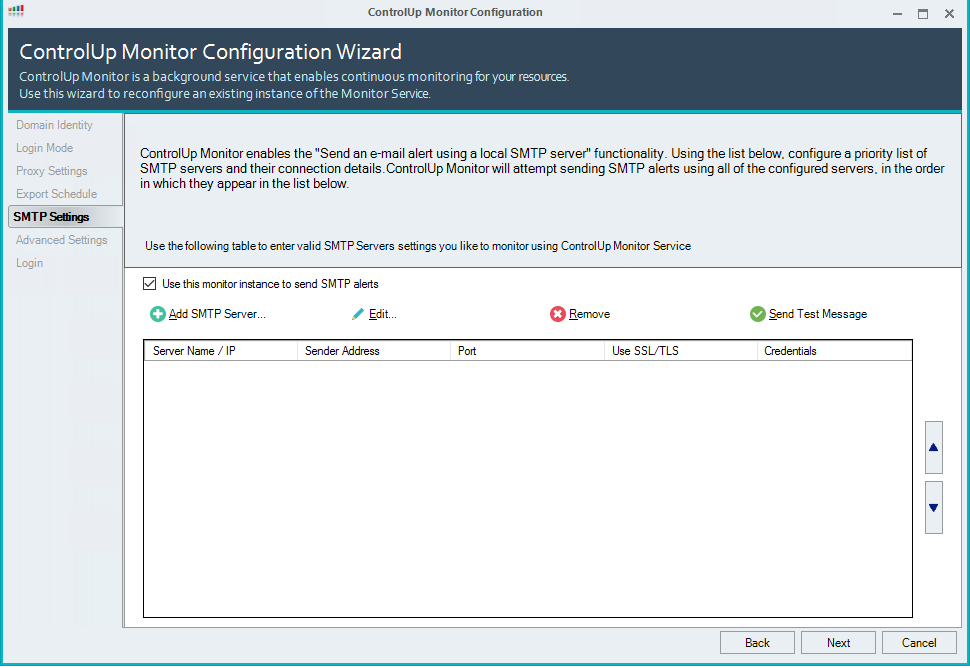
If you want you can configure a SMTP server to send warning emails. Click on Next.
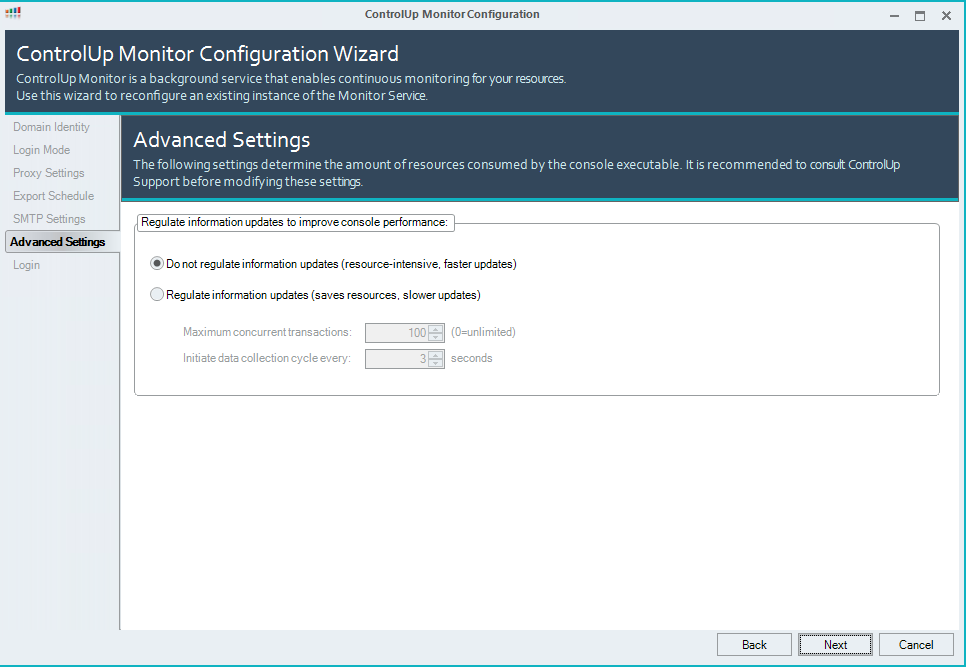
Choose the setting which is best for your environment and click next.
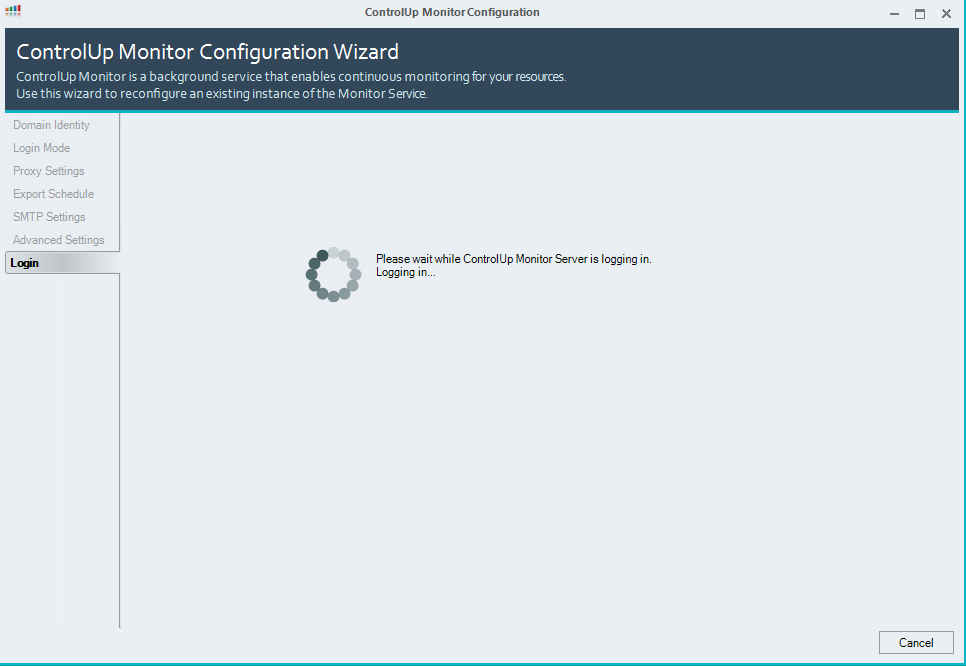
The monitor service will now be configured and f you have chosen Online it will sign into ControlUp.
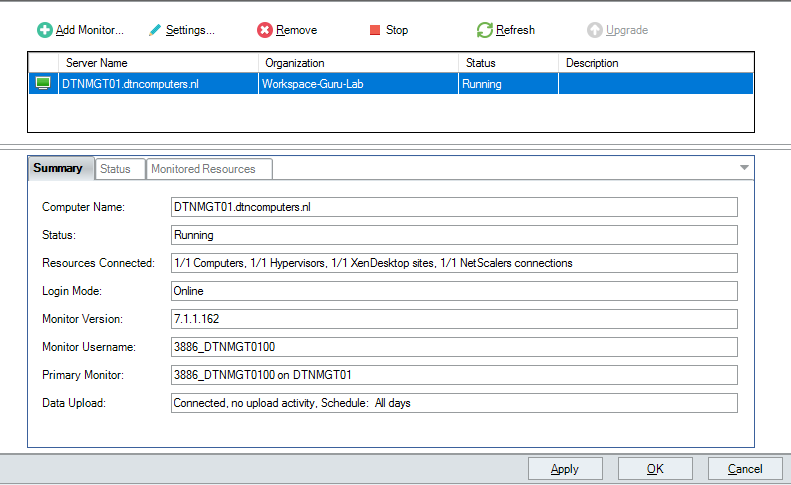
Once everything is finished you can see your monitor is running.
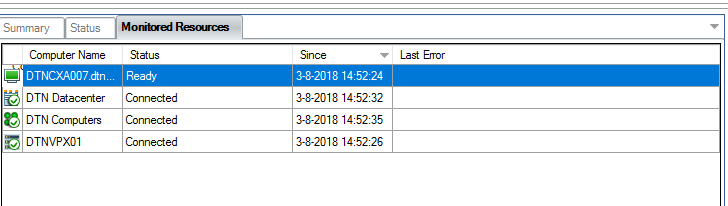
If you click on the Monitored Resources tab you can see that all the connections to the computers, hypervisors, Netscaler and Citrix Environment are up.
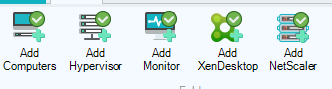
If you now go back to the console you will see green checks at every ‘Add’ option.
So thats it! Now we have our complete environment monitored and data is being send to the ControlUp Insights cloud. In an upcoming blog I will show you how to use ControlUP Insights with real world examples !
I hope this was informative. For questions or comments you can always give a reaction in the comment section or contact me:

Hello Chris,
Thank you for the post and been looking for on like this for setting up in my lab.
Can you please let me know the permissions assigned to the service account for connecting to vcenter etc for pulling the data?
Thank you,
Regards,
Pavan
Hi Pavan,
You can check out which rights are needed here: https://support.controlup.com/hc/en-us/articles/360000728405-Setting-permissions-for-ControlUp-in-VMware-vCenter?mobile_site=true
Gr Chris